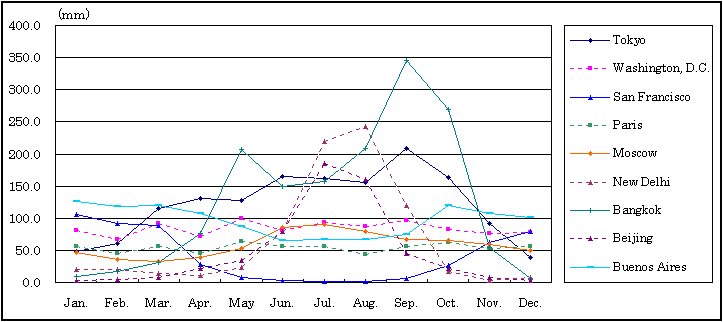
International Comparison of Average Precipitation
| (mm) |
 |
Total |
Jan. |
Feb. |
Mar. |
Apr. |
May |
Jun. |
| Tokyo |
1,466.7 |
48.6 |
60.2 |
114.5 |
130.3 |
128.0 |
164.9 |
| Washington, D.C. |
1,004.2 |
81.5 |
66.7 |
91.4 |
71.8 |
99.1 |
80.9 |
| San Francisco |
500.9 |
106.6 |
91.2 |
88.8 |
28.5 |
8.0 |
2.5 |
| Paris |
647.6 |
55.8 |
45.8 |
55.4 |
45.0 |
63.3 |
56.8 |
| Moscow |
705.3 |
46.5 |
36.0 |
33.1 |
39.2 |
53.1 |
85.9 |
| New Delhi |
779.1 |
20.8 |
20.9 |
14.1 |
10.5 |
22.7 |
79.4 |
| Bangkok |
1,529.5 |
9.4 |
16.6 |
31.5 |
76.3 |
207.3 |
149.6 |
| Beijing |
575.2 |
2.9 |
5.3 |
8.3 |
21.4 |
33.7 |
78.6 |
| Buenos Aires |
1,162.5 |
125.7 |
119.0 |
120.5 |
107.5 |
87.5 |
65.8 |
|
| (mm) |
 |
Jul. |
Aug. |
Sep. |
Oct. |
Nov. |
Dec. |
| Tokyo |
161.5 |
155.1 |
208.5 |
163.1 |
92.5 |
39.6 |
| Washington, D.C. |
92.9 |
87.5 |
96.2 |
81.9 |
76.9 |
77.4 |
| San Francisco |
0.9 |
1.4 |
5.5 |
26.6 |
62.0 |
79.1 |
| Paris |
55.5 |
43.5 |
56.1 |
62.6 |
52.2 |
55.5 |
| Moscow |
89.6 |
80.0 |
67.1 |
65.6 |
59.0 |
50.2 |
| New Delhi |
219.2 |
242.8 |
119.1 |
17.6 |
3.6 |
8.4 |
| Bangkok |
157.0 |
207.8 |
345.3 |
269.5 |
53.7 |
5.6 |
| Beijing |
185.5 |
160.4 |
45.8 |
22.1 |
7.8 |
3.4 |
| Buenos Aires |
66.6 |
67.4 |
74.7 |
119.5 |
107.5 |
101.0 |
|

Note :
Normal precipitation in Paris and San Francisco is based on records for a
26-year period, 1971-1996 inclusive.
Other cities are based on records for a 30-year period, 1971-2000 inclusive.
Source :
Rika Nempyo (Chronological Scientific Tables)
National Astronomical Observatory
(Nov. 30, 2001)
2-21-1 Osawa, Mitaka-shi, Tokyo 181-8588
Phone: +81-422-34-3600
http://web-japan.org/stat/stats/01CEN16.html
