Plotting Diffraction Patterns
Fresnel-Kirchoff Formula - Fresnel Approximation
| > |
F:=(ax,cx,ay,cy,k,d)->-I/lambda*exp(I*k*d)*exp(I*(k/2/d*(x^2+y^2)))*int(int(exp(I*k/2/d*(u^2+v^2))*exp(I*k/d*(x*u+y*v)),u=ax..cx),v = ay..cy); |
 |
(1) |
Fresnel-Kirchoff Formula - Fraunhofer Approximation
| > |
G:=(ax,cx,ay,cy,k,d)->-I/lambda*exp(I*k*d)*exp(I*(k/2/d*(x^2+y^2)))*int(int(exp(I*k/d*(x*u+y*v)),u=ax..cx),v = ay..cy); |
 |
(2) |
Narrow Slit Intensities
Fresnel Approximation
| > |
lambda:=5: M:=10: L:=1: EE:=F(-L/2,L/2,-M/2,M/2,2*Pi/lambda,10): |
| > |
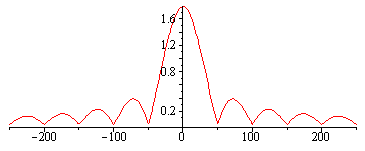
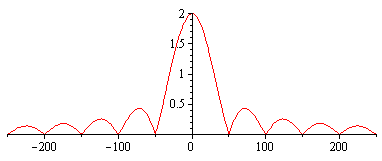
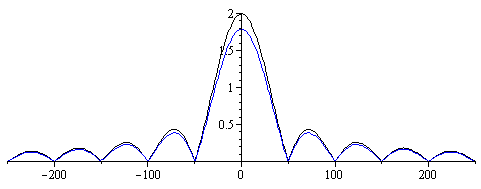
plot(subs(y=0.001,Intensity1),x=-50*lambda..50*lambda); |
Fraunhofer Approximation
| > |
EE:=G(-L/2,L/2,-M/2,M/2,2*Pi/lambda,10): |
| > |
plot(subs(y=0.001,Intensity2),x=-50*lambda..50*lambda); |
Comparison of Approximations
| > |
plot({subs(y=0.001,Intensity1),subs(y=0.001,Intensity2)},x=-50*lambda..50*lambda,color=[black,blue]); |
Fraunhofer Condition: Need d >> k/2 (aperture area). d above is 10. But
 |
(3) |
Special Functions
Sinc Function - Single Slit
| > |
plot(sinc(x)^2,x=-10..10); |
Bessel Functions
| > |
plot(BesselJ(1,x),x=0..30); |
Zeros of Bessel Functions
 |
(4) |
 |
(5) |
Jinc Function
| > |
Jinc:=x->(2*BesselJ(1,x)/x): plot(Jinc(x),x=0..30); |
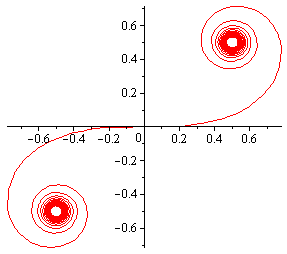
Fresnel Integrals and the Cornu Spiral
| > |
plot([FresnelC(x),FresnelS(x),x=-10..10]); |
Simple Diffraction Patterns
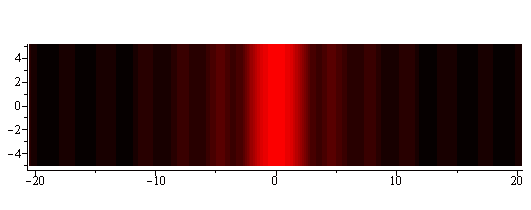
Narrow Slit: ![I = `*`(I[0], `*`(`^`(sinc(x), 2)))](images/DiffractionNew_13.gif)
| > |
densityplot(sqrt(sqrt(sinc(x)^2)),x=-20..20,y=-5..5,axes=frame,style=PATCHNOGRID,grid=[50,50],color=red,scaling=constrained); |
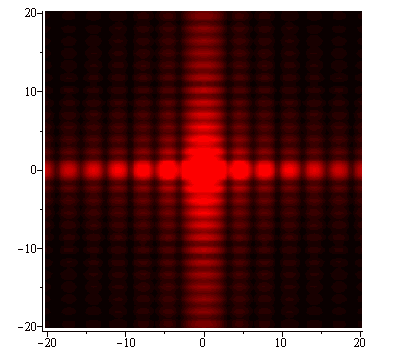
Rectangular Aperture: ![I = `*`(I[0], `*`(`^`(sinc(x), 2), `*`(`^`(sinc(y), 2))))](images/DiffractionNew_15.gif)
| > |
densityplot(sqrt(sqrt(sinc(x)^2*sinc(2*y)^2)),x=-20..20,y=-20..20,axes=frame,style=PATCHNOGRID,grid=[100,100],color=red,scaling=constrained); |
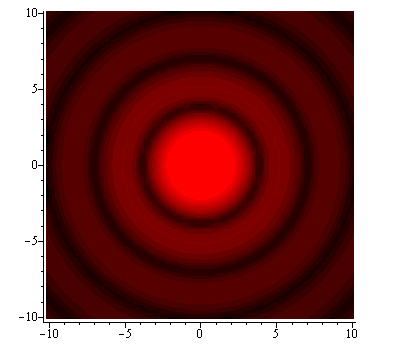
Circular Aperture: ![I = `*`(I[0], `*`(`^`(Jinc(r), 2)))](images/DiffractionNew_17.gif)
| > |
densityplot(sqrt(sqrt(Jinc((sqrt(x^2+y^2)))^2)),x=-10..10,y=-10..10,axes=frame,style=PATCHNOGRID,grid=[70,70],color=red,scaling=constrained); |
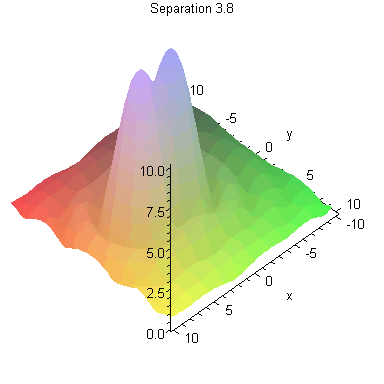
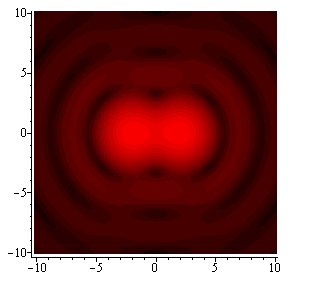
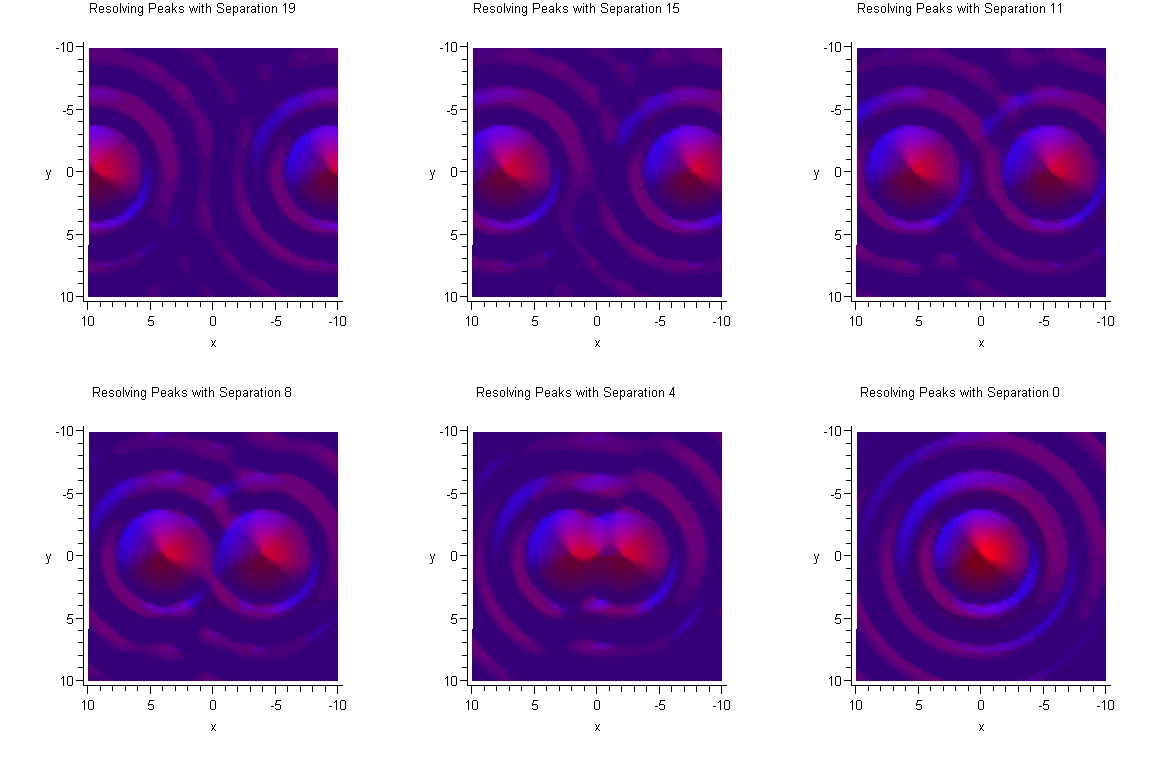
Resolving Peaks
| > |
c:=3.8: plot({Jinc(x)^2+Jinc(x-c)^2,Jinc(x)^2,Jinc(x-c)^2},x=-30..30,color=[red,blue,black]); |
| > |

 |
| > |
densityplot(sqrt(sqrt(Jinc(sqrt((x+c/2)^2+y^2))^2+Jinc(sqrt((x-c/2)^2+y^2))^2)),x=-10..10,y=-10..10,axes=frame,style=PATCHNOGRID,grid=[70,70],color=red,scaling=constrained); |
| > |
![display(seq(P[k], k = 1 .. 20), insequence = true); 1](images/DiffractionNew_28.gif) |
Double Slit - width b, separation a with a>b.
![I = `+`(`*`(4, `*`(I[0], `*`(`^`(cos(`+`(`*`(`/`(1, 2), `*`(k, `*`(a, `*`(sin(theta))))))), 2), `*`(`^`(sinc(`+`(`*`(`/`(1, 2), `*`(k, `*`(b, `*`(sin(theta))))))), 2))))))](images/DiffractionNew_30.gif)
| > |
beta:=a/2*sin(x): alpha:=b/2*sin(x): |
| > |
Intensity:=(a,b)->4*cos(a/2*sin(x))^2*sinc(b/2*sin(x))^2: |
| > |
plot(Intensity(20,5),x=-5..5); |
| > |
densityplot(sqrt(sqrt(Intensity(20,5))),x=-5..5,y=-1..1,axes=frame,style=PATCHNOGRID,grid=[50,50],color=red,scaling=constrained); |
| > |
lambda:=5: a:=20: b:=19: L:=1: EE:=G(-L/2,L/2,(a-b)/2,(a+b)/2,2*Pi/lambda,10)+G(-L/2,L/2,-(a+b)/2,-(a-b)/2,2*Pi/lambda,10): |
| > |
plot(subs(x=0.001,Intensity),y=-5..5,numpoints=200); |
| > |
densityplot(sqrt(sqrt(subs(x=0.001,Intensity))),y=-5..5,x=-1..1,axes=frame,style=PATCHNOGRID,grid=[50,50],color=red); |
N Slits ![I = `*`(I[0], `*`(`^`(sinc(beta), 2), `*`(`^`(`/`(`*`(sin(`*`(N, `*`(alpha)))), `*`(sin(alpha))), 2))))](images/DiffractionNew_35.gif)
| > |
beta:=a/2*sin(x): alpha:=b/2*sin(x): |
| > |
Intensity:=(a,b)->sin(a*N/2*sin(x))^2*sinc(b/2*sin(x))^2/sin(a/2*sin(x))^2; |
 |
(6) |
| > |
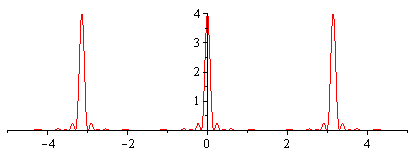
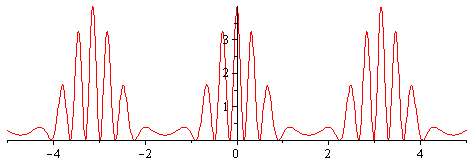
N:=2:plot(Intensity(20,19),x=-5..5,numpoints=200); |
| > |
densityplot(sqrt(sqrt(Intensity(20,19))),x=-5..5,y=-1..1,axes=frame,style=PATCHNOGRID,grid=[50,50],color=red); |
| > |
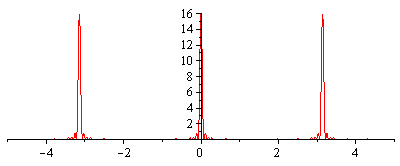
N:=4:plot(Intensity(20,19),x=-5..5,numpoints=200); |
| > |
![densityplot(sqrt(sqrt(Intensity(20, 19))), x = -5 .. 5, y = -1 .. 1, axes = frame, style = PATCHNOGRID, grid = [50, 50], color = red, scaling = constrained); 1](images/DiffractionNew_40.gif)
![densityplot(sqrt(sqrt(Intensity(20, 19))), x = -5 .. 5, y = -1 .. 1, axes = frame, style = PATCHNOGRID, grid = [50, 50], color = red, scaling = constrained); 1](images/DiffractionNew_41.gif) |
| > |
 |




![]()
![]()
![]()

![]()


![]()

