HW2 Answers
Below
is data collected from a sample of 20 college students on what grade they
expect to receive in their SOC 301 course:
100,
75, 75, 88, 81, 72, 77, 75, 71, 77, 95, 85, 81, 90, 40, 71, 77, 88, 70, 90
1.
Make a frequency table, including the frequency, percentage, valid
percentage and cumulative percentage.
|
|
Frequency |
Percent |
Valid Percent |
Cumulative Percent |
|
40.00 |
1 |
5.0 |
5.0 |
5.0
|
|
70.00 |
1 |
5.0 |
5.0 |
10.0
|
|
71.00 |
2 |
10.0 |
10.0 |
20.0
|
|
72.00 |
1 |
5.0 |
5.0 |
25.0
|
|
75.00 |
3 |
15.0 |
15.0 |
40.0
|
|
77.00 |
3 |
15.0 |
15.0 |
55.0
|
|
81.00 |
2 |
10.0 |
10.0 |
65.0
|
|
85.00 |
1 |
5.0 |
5.0 |
70.0
|
|
88.00 |
2 |
10.0 |
10.0 |
80.0
|
|
90.00 |
2 |
10.0 |
10.0 |
90.0
|
|
95.00 |
1 |
5.0 |
5.0 |
95.0
|
|
100.00 |
1 |
5.0 |
5.0 |
100.0 |
|
Total |
20 |
100.0 |
100.0 |
|
2.
What is the mode, median and mean of the above data?
|
Mean |
78.90 |
|
Median |
77.00 |
|
Mode |
75.00, 77.00 |
|
x |
f |
xf |
|
40 |
1 |
40 |
|
70 |
1 |
70 |
|
71 |
2 |
142 |
|
72 |
1 |
72 |
|
75 |
3 |
225 |
|
77 |
3 |
231 |
|
81 |
2 |
162 |
|
85 |
1 |
85 |
|
88 |
2 |
176 |
|
90 |
2 |
180 |
|
95 |
1 |
95 |
|
100 |
1 |
100 |
|
|
|
1578 |
Mean
= 1578/20 = 78.90
3. What
is the range, variance, and standard deviation of the
above data?
|
Std. Deviation |
12.53 |
|
Variance |
157.04 |
|
Range |
60.00 |
|
|
|
|
x |
f |
x*x |
x*x*f |
xf |
|
40 |
1 |
1600 |
1600 |
40 |
|
70 |
1 |
4900 |
4900 |
70 |
|
71 |
2 |
5041 |
10082 |
142 |
|
72 |
1 |
5184 |
5184 |
72 |
|
75 |
3 |
5625 |
16875 |
225 |
|
77 |
3 |
5929 |
17787 |
231 |
|
81 |
2 |
6561 |
13122 |
162 |
|
85 |
1 |
7225 |
7225 |
85 |
|
88 |
2 |
7744 |
15488 |
176 |
|
90 |
2 |
8100 |
16200 |
180 |
|
95 |
1 |
9025 |
9025 |
95 |
|
100 |
1 |
10000 |
10000 |
100 |
|
|
|
|
127488 |
1578 |
See
board for calculation of standard deviation.
4.
Are their any outliers? If so, which ones are they? Which outlier definition
did you use? (Show your math)
78.9
+/- 3 (12.53)
+3
s = 116.49
-3
s = 41.31
There is one outlier – the response 40.
Because there is an outlier, I would use the mode and median to
summarize the data, not the mean. Most people expect to receive a 75. And 50% of the students expect to do better
than a 77 and 50% expect to do worse than a 77.
5.
Make a graph to display the above data.
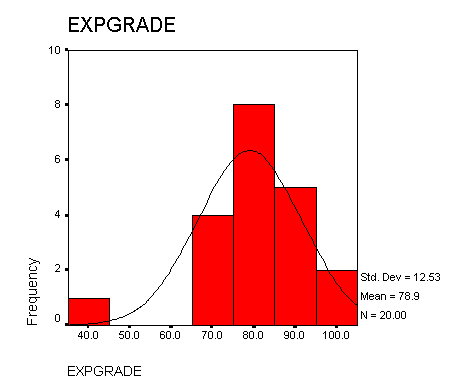
6.
Does the above data approximate a normal distribution?
It would if we removed the outlier of 40.
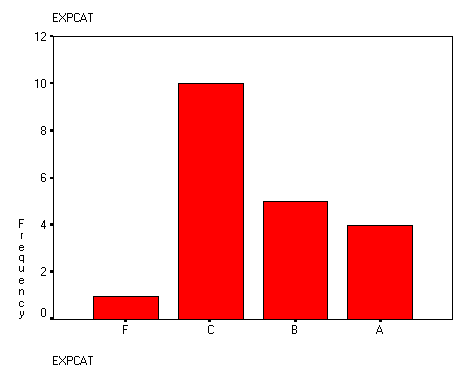
7. Recode
the above data into a variable with the following categories (A, B, C, D, F). Make a new
frequency distribution , including the frequency,
percentage, valid percentage and cumulative percentage.
|
|
Frequency |
Percent |
Valid Percent |
Cumulative Percent |
|
1.00
F |
1 |
5.0 |
5.0 |
5.0
|
|
3.00
C |
10 |
50.0 |
50.0 |
55.0
|
|
4.00
B |
5 |
25.0 |
25.0 |
80.0
|
|
5.00
A |
4 |
20.0 |
20.0 |
100.0
|
|
Total |
20 |
100.0 |
100.0 |
|
|
Median |
3.00 |
|
Mode |
3.00 |
|
Range |
4.00 |
8.
Make a new graph to display the recoded data.