| Charts and Graphs:
Explaining With Visuals |
The Great Barrier Reef off the
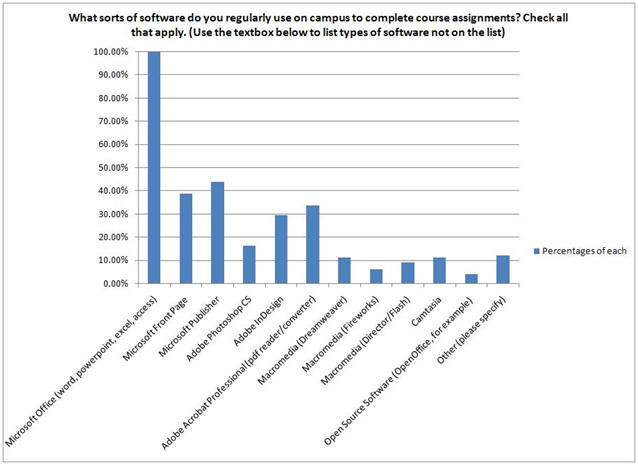
Table 1: Software Respondents Reported Using Regularly to Complete Course Assignments (N=98)
|
| Charts and Graphs:
Explaining With Visuals |
The Great Barrier Reef off the
Table 1: Software Respondents Reported Using Regularly to Complete Course Assignments (N=98)
|